


A look into DEX Capital Efficiency
Short analysis on how much revenue decentralized exchanges are able to generate per unit of available liquidity

When analyzing an automated market maker (AMM) decentralized exchange (DEX), it's essential to look at efficiency metrics that provide an indication on how efficiently an AMM DEX is able to generate volume & revenues on its TVL. This article provides an investor's guide on DEX capital efficiency, featuring the leading AMM DEX protocols.
Often people use the TVL (total value locked) metric in order to measure success of decentralized exchanges. However, this metric alone can be very misleading. The goal of a DEX is to generate volume and subsequently earn trading fees. A better DEX metric than TVL is hence capital efficiency or in different words, how well a DEX is able to maximize utilization of the available liquidity (get volume) & generate revenue on the pools.
In this short analysis, we will divide total 365d revenue by TVL (avg. last 365d) in order to arrive at a simplified metric for DEX capital efficiency (revenue generated per liquidity unit).
The focus will be on the following DEX protocols:
Uniswap
Sushiswap
Trader Joe
SpookySwap
Quickswap
Clipper DEX
Uniswap is the largest DEX by TVL and volume. Its total value locked amounts to currently $5.6bn and on average, Uniswap TVL has amounted to approx. $7bn during the past 365 days:

4/ Based on data from Token Terminal, during the past 365 days, Uniswap generated $1.2bn in revenues:

Consequently, Uniswap's revenue/TVL ratio on an annual basis amounts to 0.17.
SushiSwap's TVL amounts to $675m with an average of approximately $3bn over the past year:

SushiSwap generated $270m during the past 365 days based on data from Token Terminal:

Consequently, this leaves us with a revenue/TVL ratio of 0.09 for SushiSwap.
Trader Joe on the other hand is the largest DEX on the Avalanche network measured by TVL and currently stands at $162m with an average TVL of approximately $850m during the past 365 days:

During the same time period, Trader Joe generated $260m in revenues:

Consequently, Trader Joe's ratio amounts to 0.3.
SpookySwap is the largest DEX on the Fantom Opera network with a TVL of $122m and an average of roughly $500m during the last 365 days:
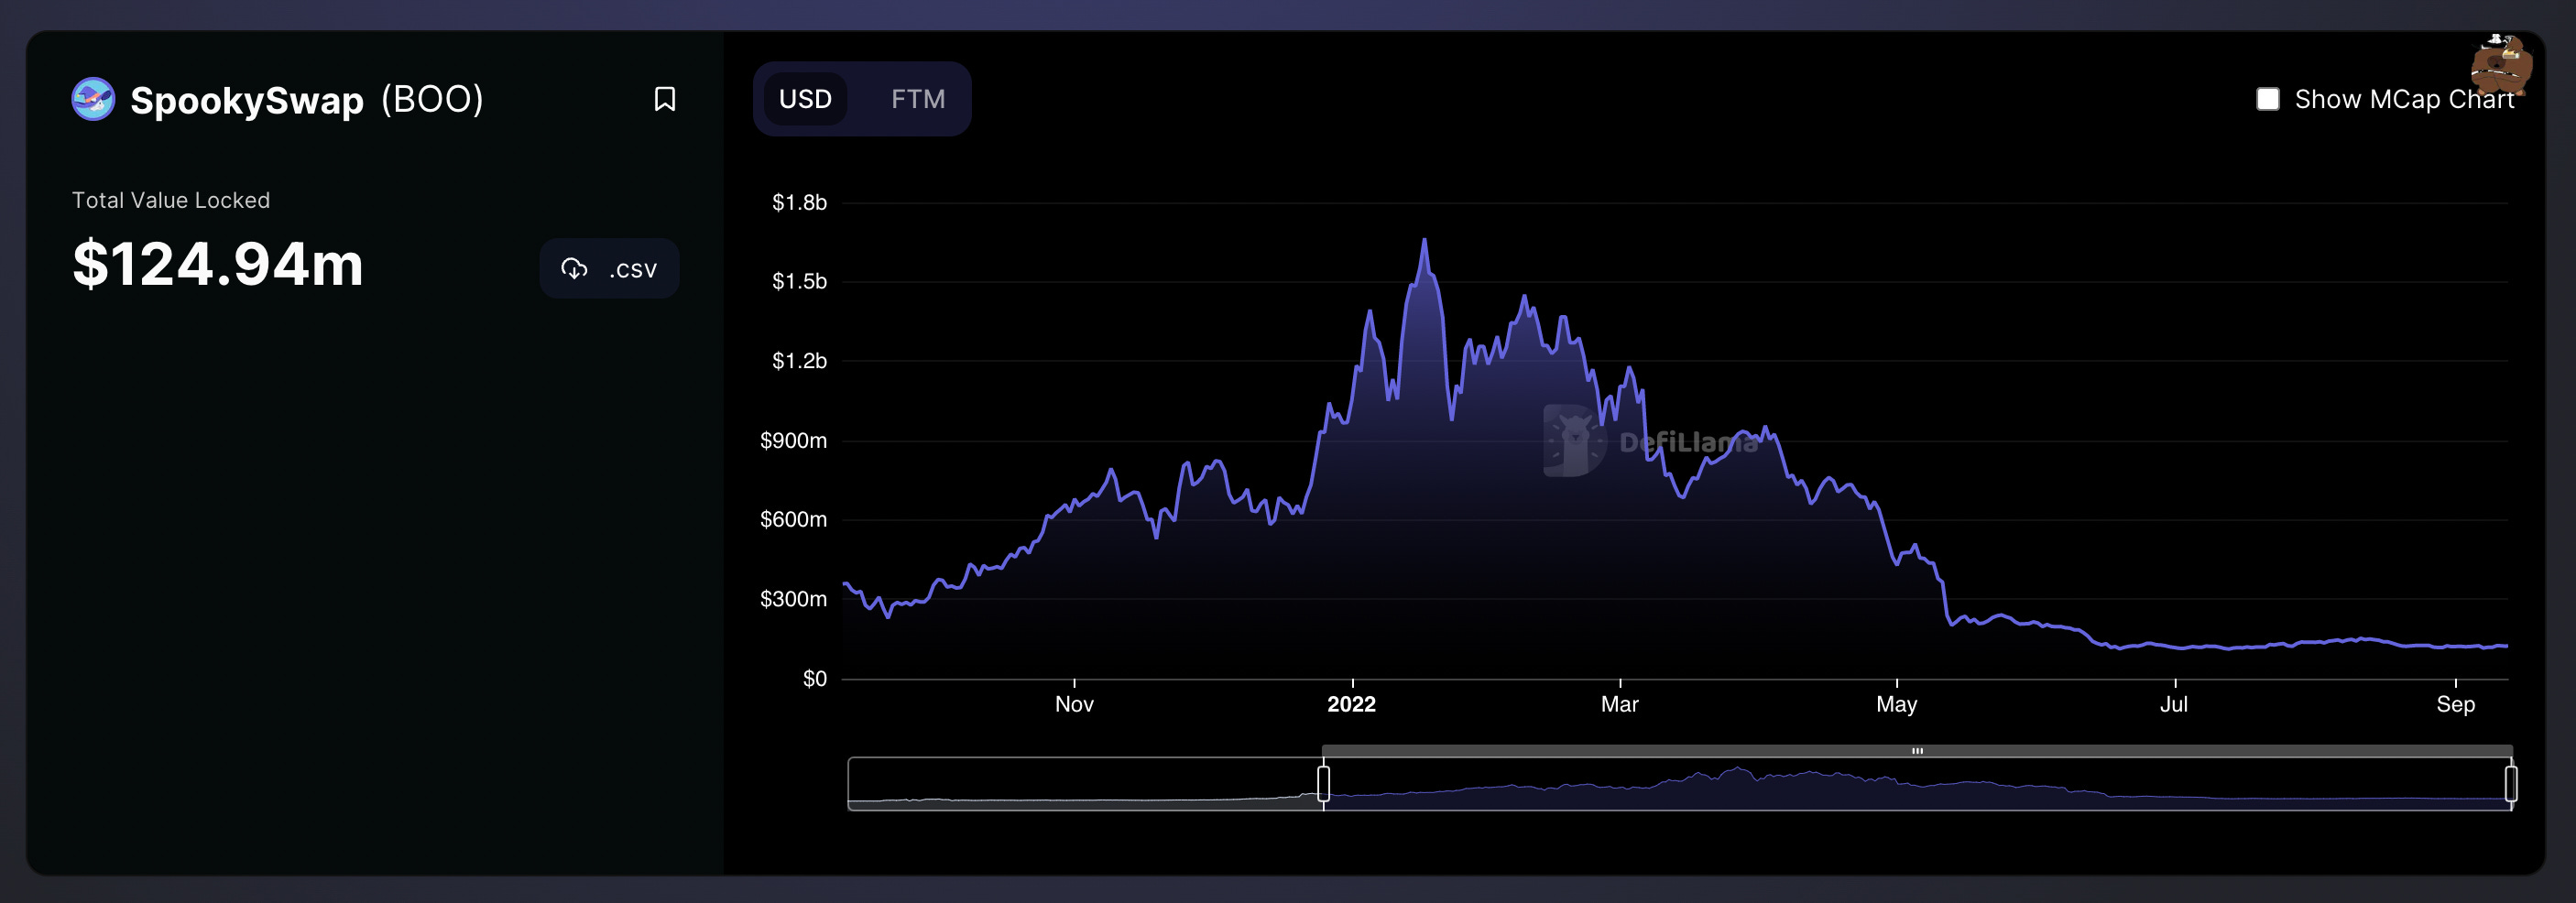
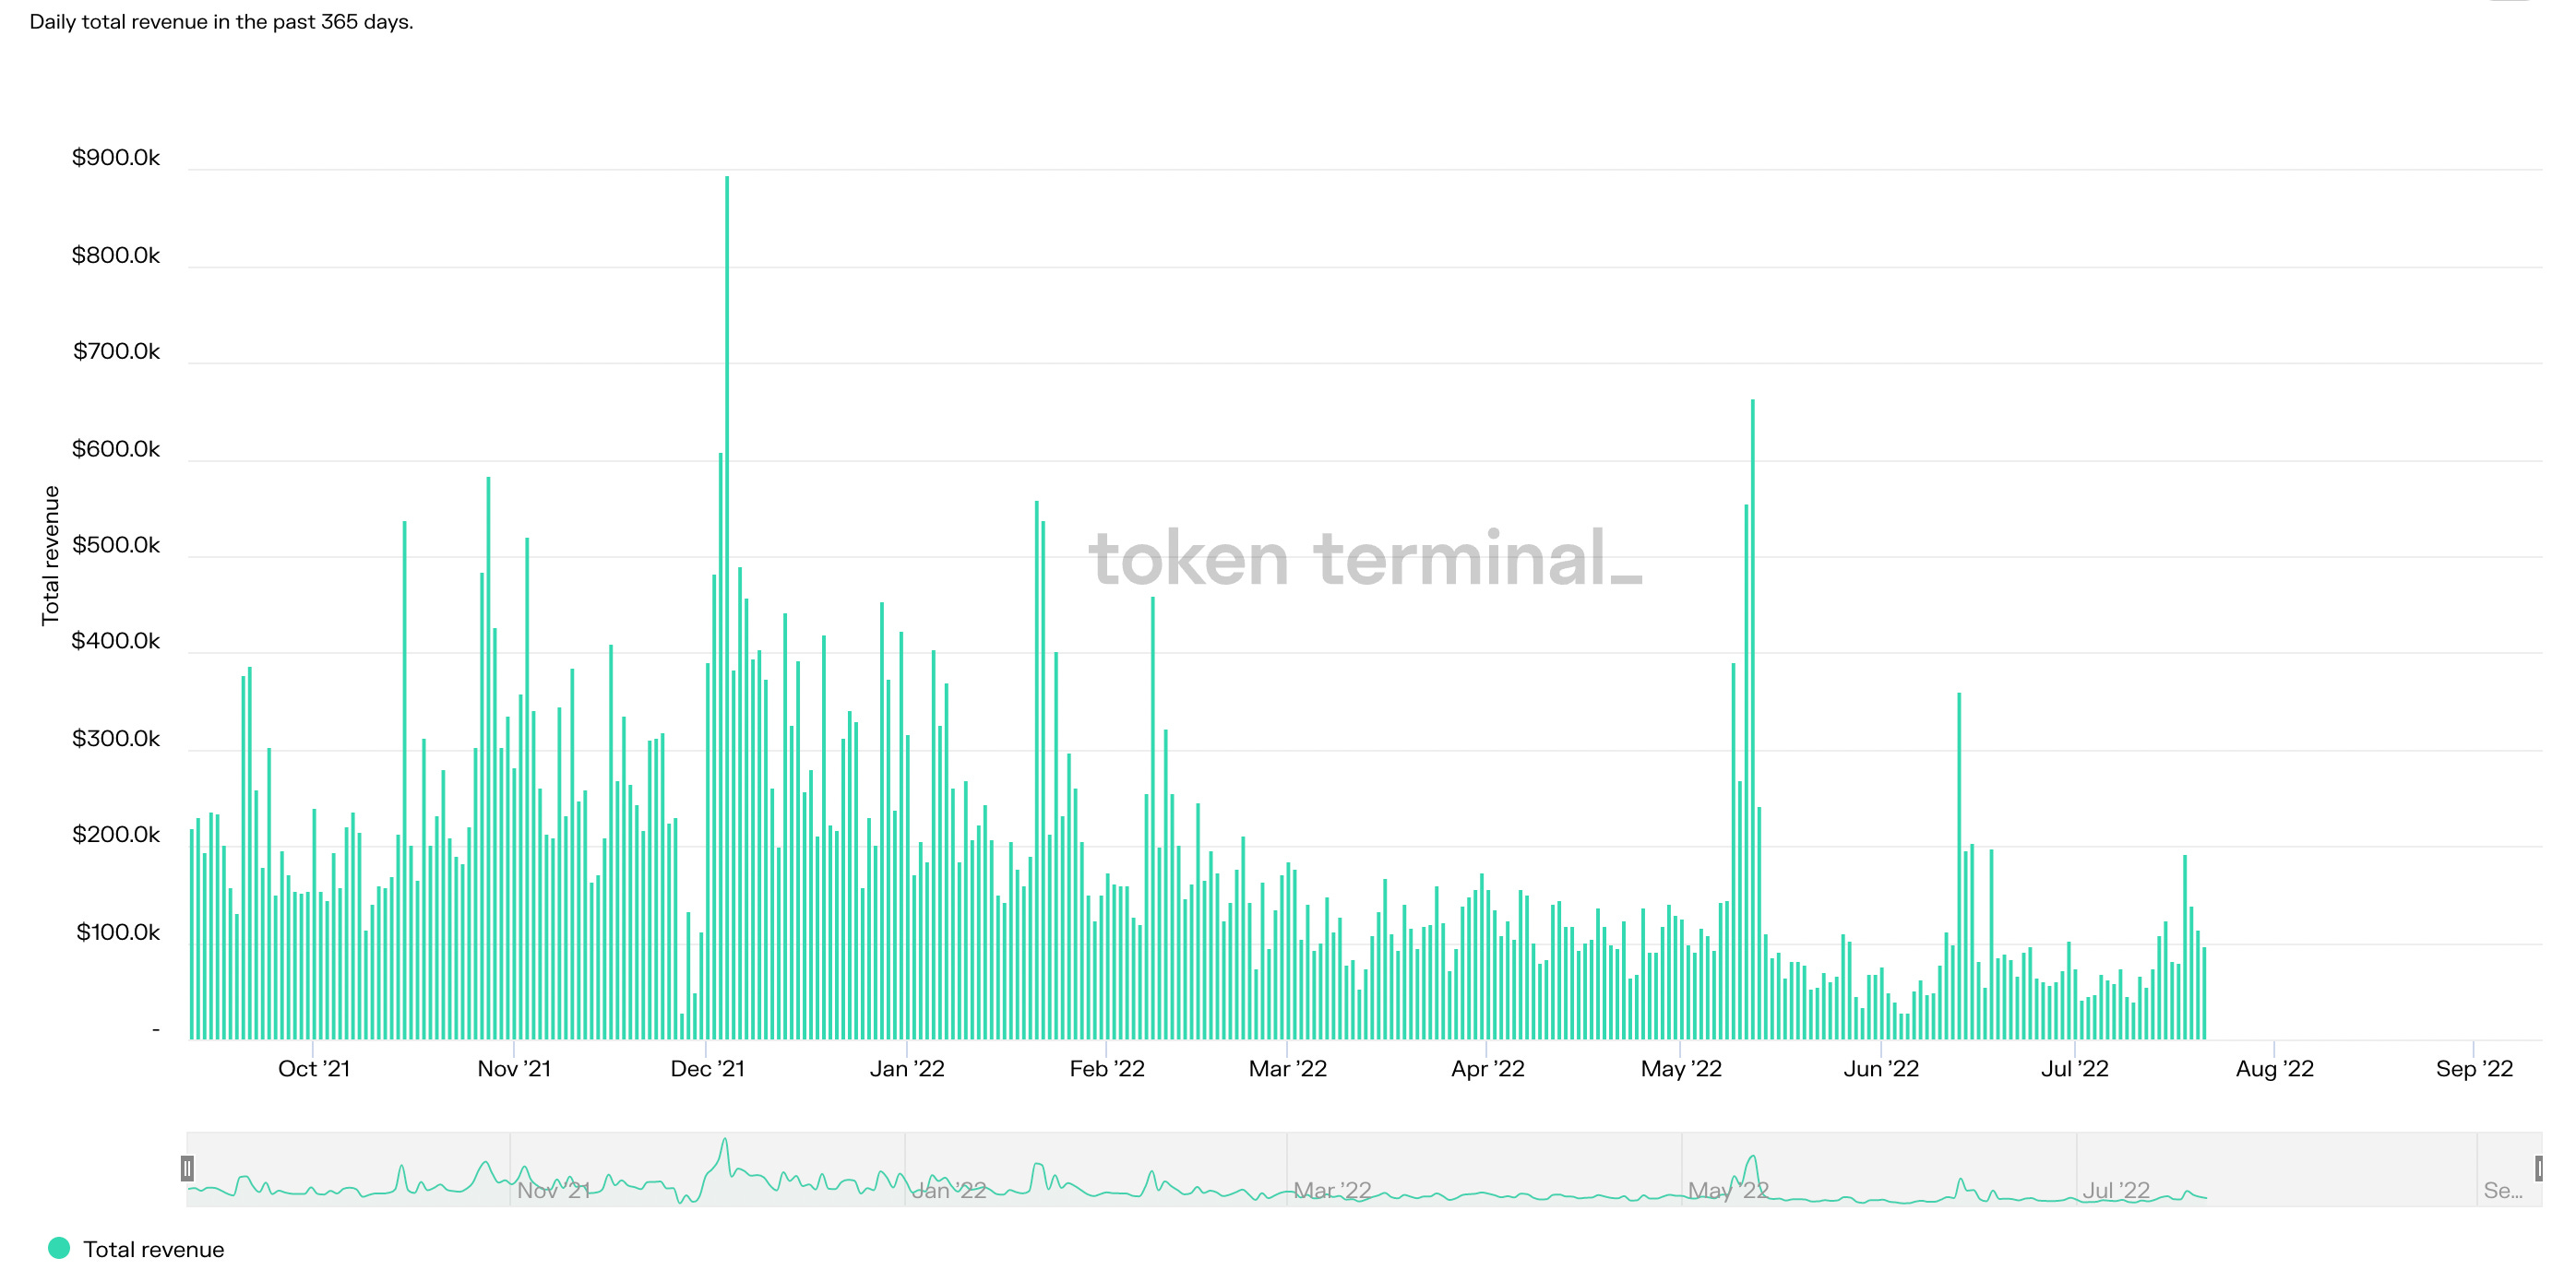
Revenues on SpookySwap during that time amount to $136m according to Token Terminal:

SpookySwap's revenue/TVL ratio hence stands at 0.27.
The largest DEX by TVL on Polygon PoS is Quickswap. Its TVL currently amounts to $275m with an average of approximately $500m during the past 365 days:
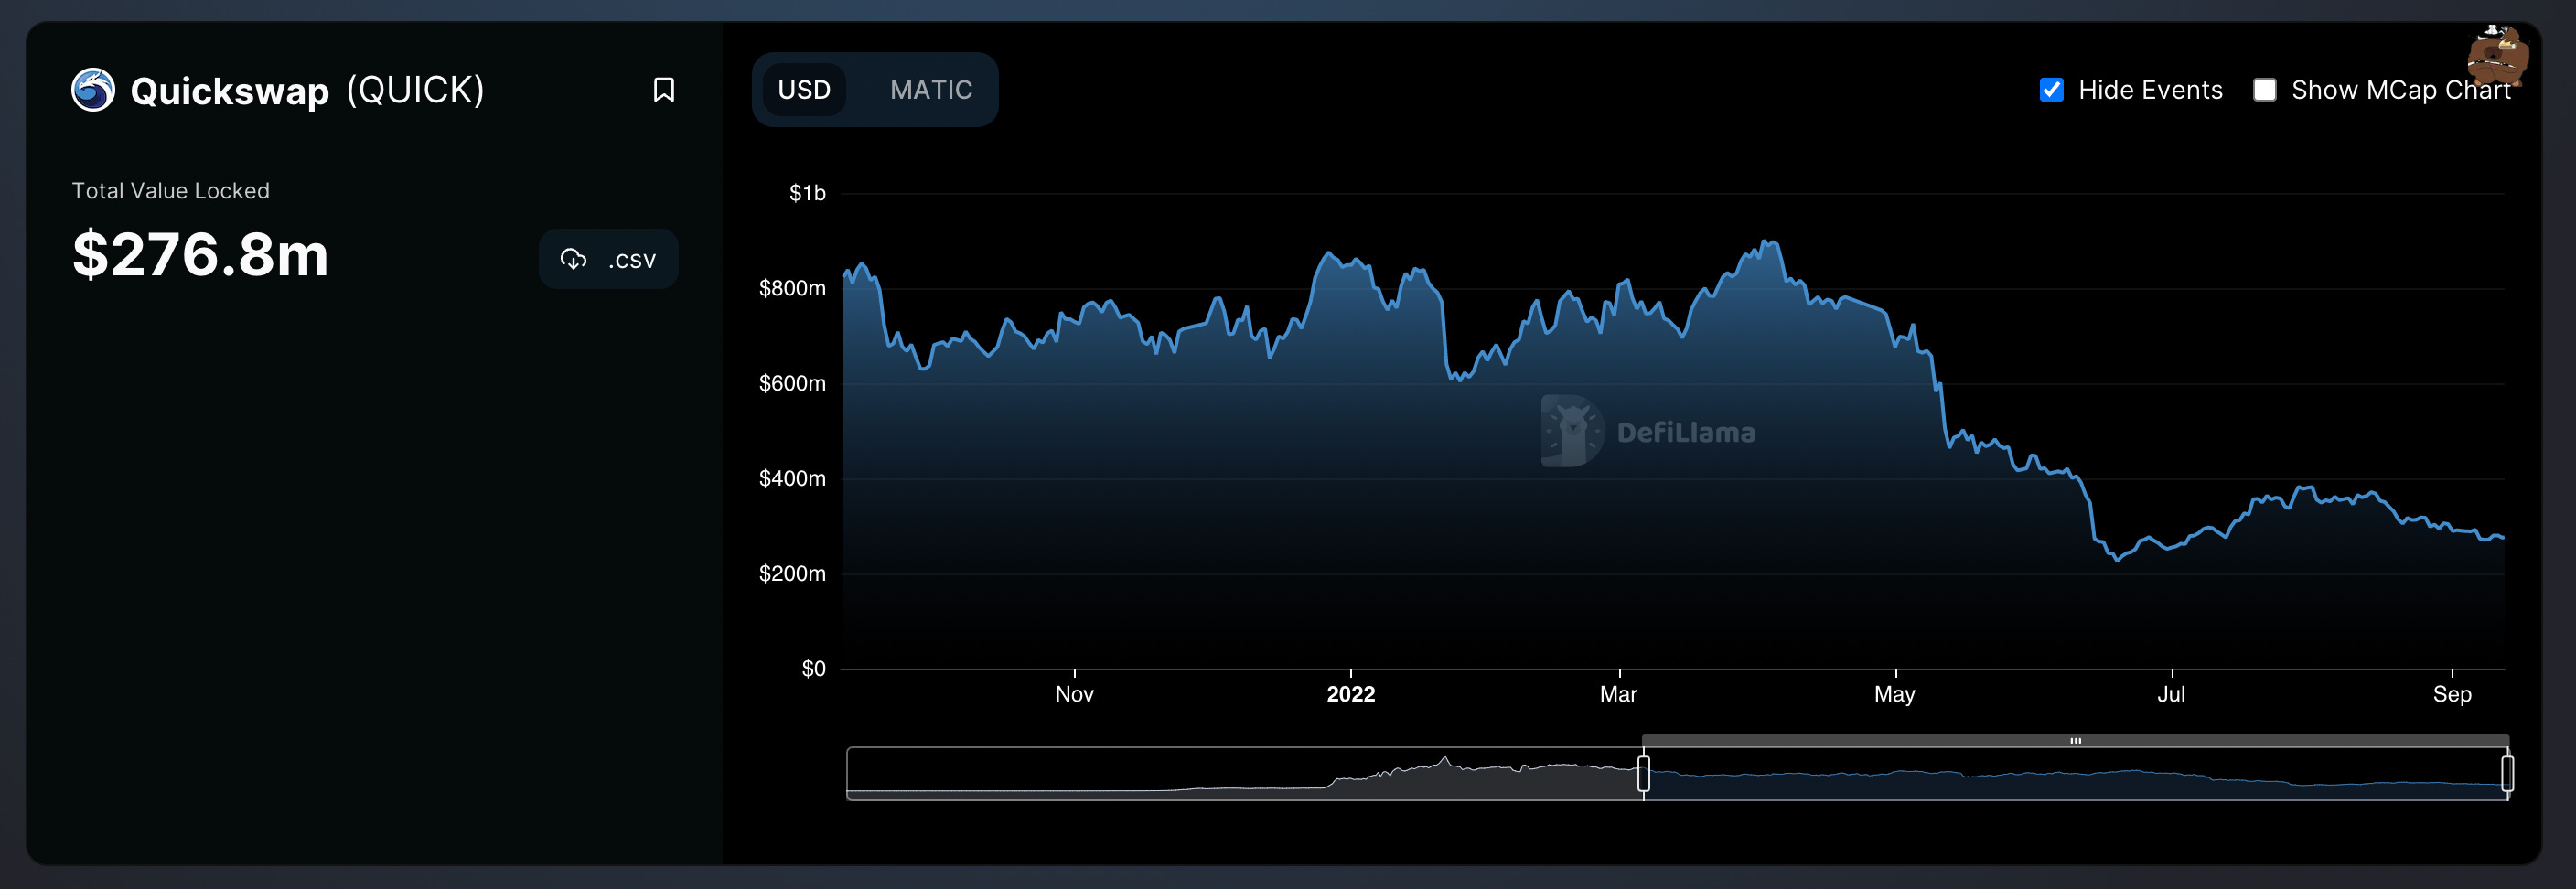
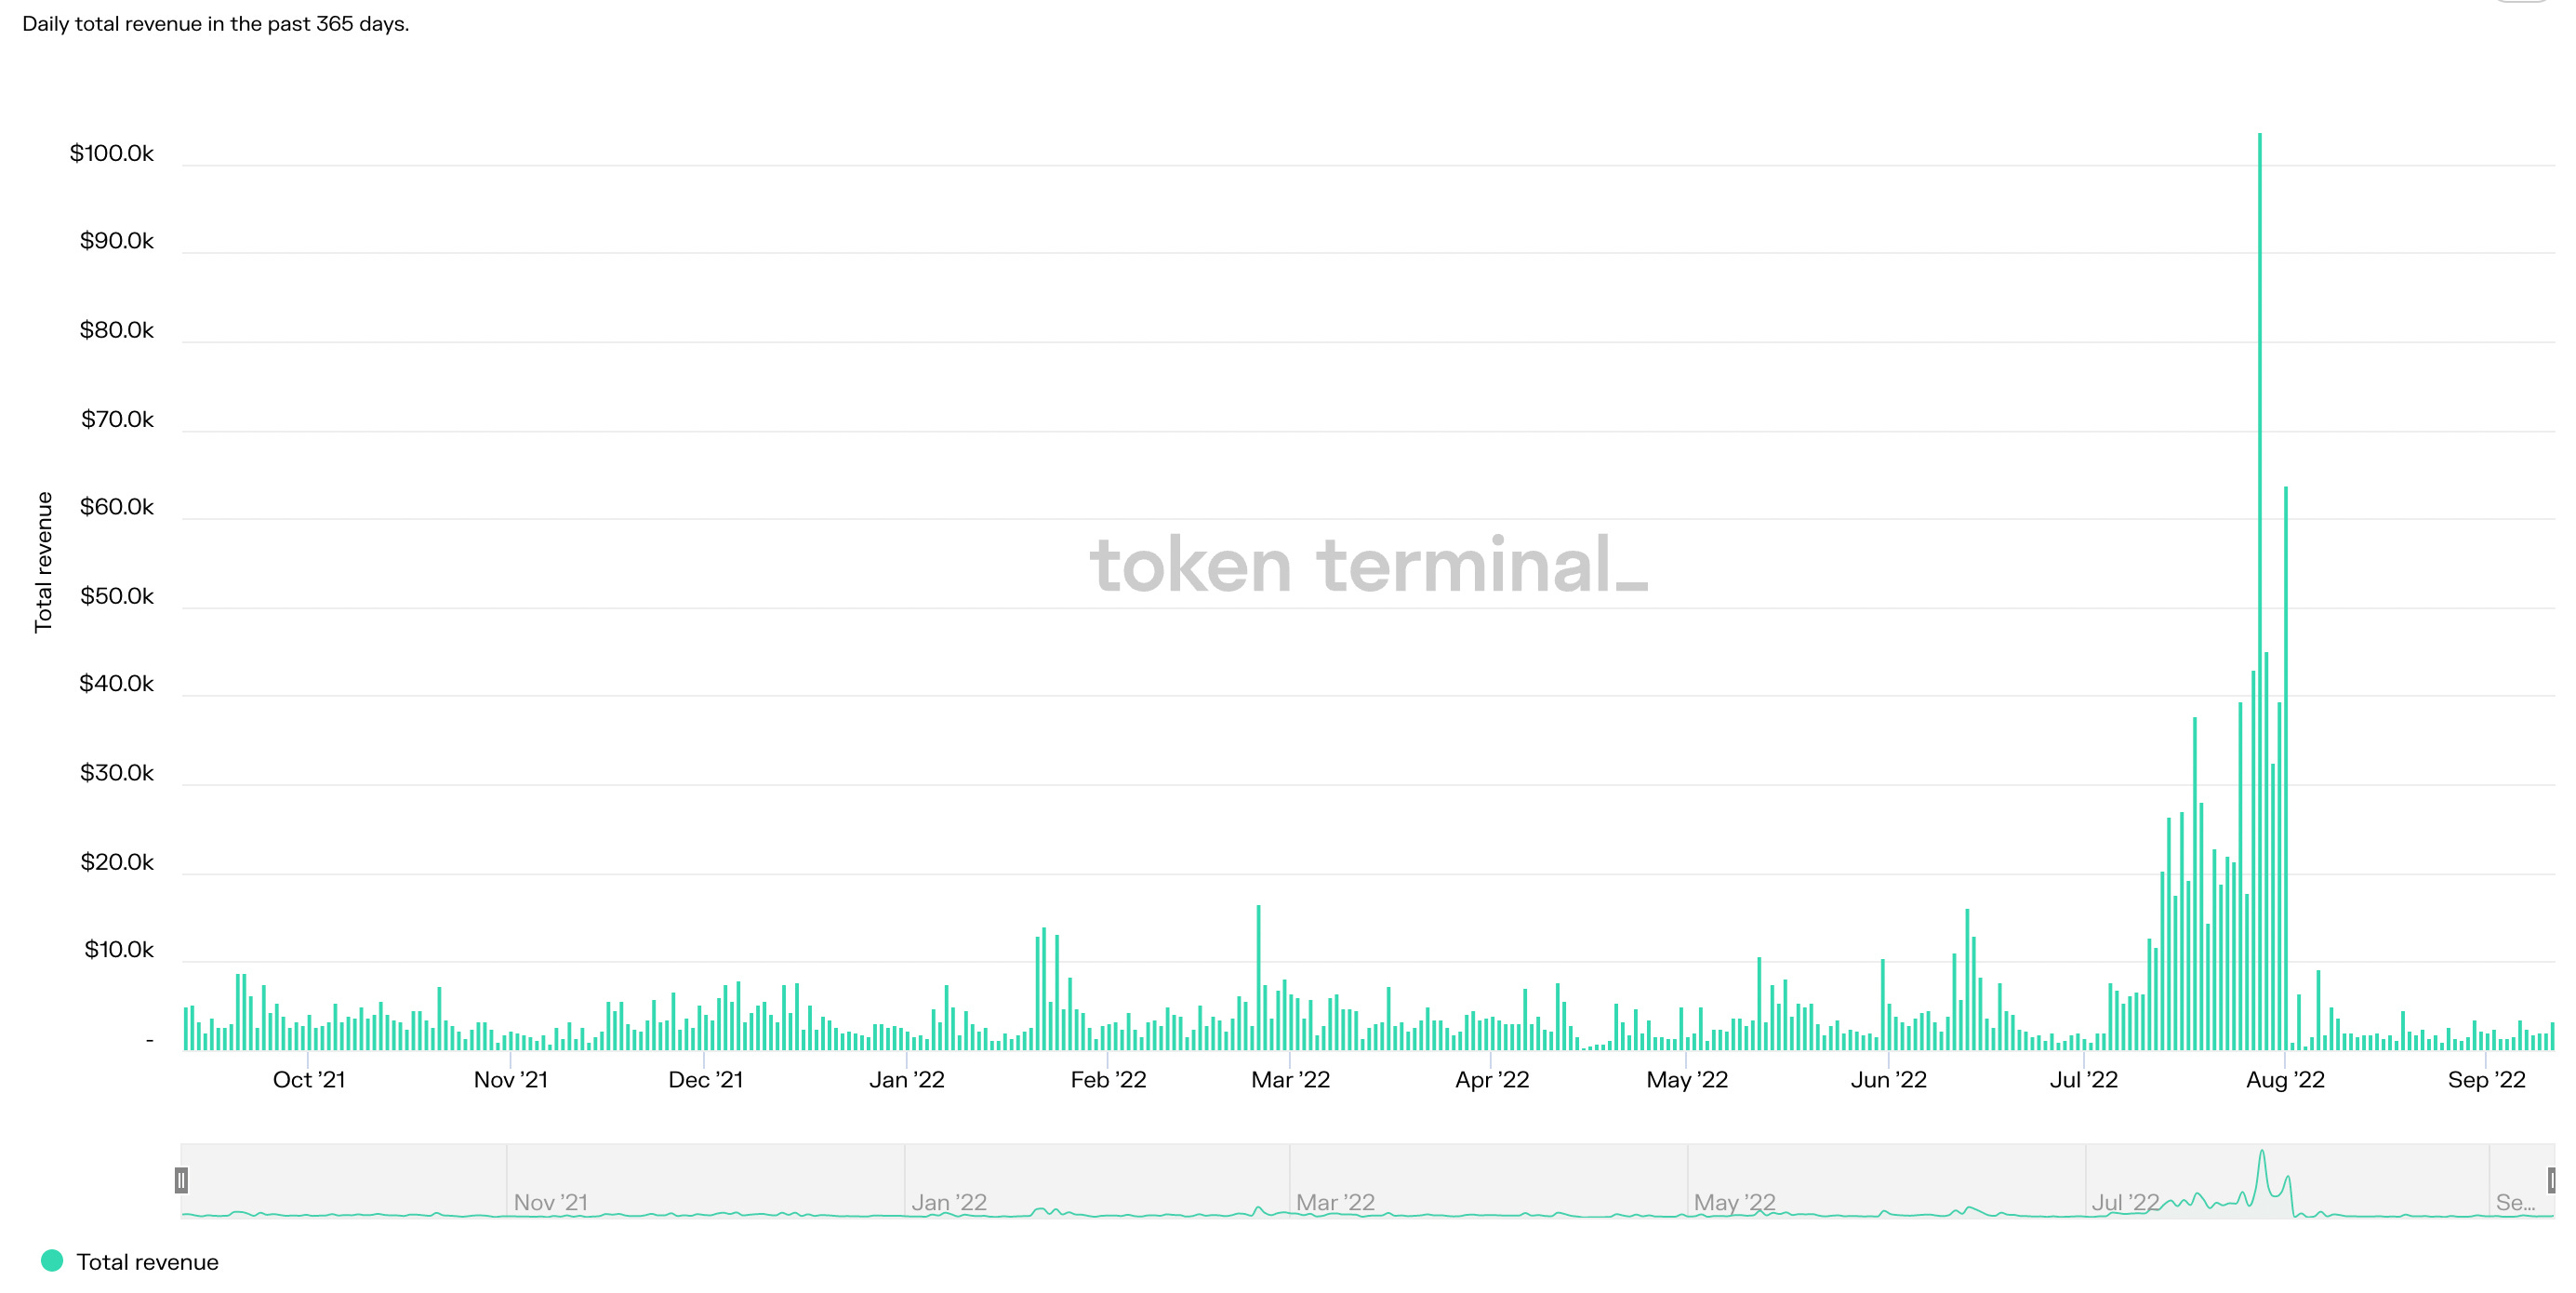
During the same time period Quickswap has generated a total of $60m in revenue:
This means a revenue/TVL ratio of 0.12 for Quickswap.
Finally, Clipper, a DEX that operates on a couple of EVM-compatible L1s & L2s (incl. Optimism), has a TVL of $10.7m with an average of roughly $17m in the past year:

Clipper has also generated a total of $895k in revenue in the past 90 days and 2m in the past 365 days:
That leaves us with a revenue/TVL ratio of 0.11
In conclusion, we have the following ratios:
1) Trader Joe: 0.3
2) SpookySwap: 0.27
3) Uniswap: 0.17
4) Quickswap: 0.12
5) Clipper DEX: 0.11
6) SushiSwap: 0.09
We need to keep in mind though, that this calculation is highly simplified and only meant to provide an indication. The approach could be modified and from a LP perspective it would probably make more sense to make the calculation based on supply-side revenue rather than total revenue, while token holders likely primarily care about protocol revenue (value that accrues to the protocol). But since we're talking about a metric for the success of a DEX we look how much users are willing to pay to use the protocols and hence consider the total fee revenue that is generated, without differentiating between protocol & supply-side revenue.
While the approach is very simplified and a more comprehensive analysis that also includes the cost the protocol incurs (token emissions), etc. is necessary to make investment decisions the ratio does provide investors with an indication on how much revenue per unit of TVL the protocols are able to generate or how much users are willing to pay per unit of available TVL. An interesting insight for LPs since in relative terms there is more revenue being generated per liquidity unit (not considering liquidity mining programs) if the ratio is higher.
Similarly for investors, because revenue is a function of volume, a higher ratio shows that liquidity (TVL) is concentrated in pools generating volume & hence revenue (which is a measure for operational efficiency of a protocol). Consequently, a high ratio is desirable as unproductive liquidity that doesn't generate volume & fees is not desirable for LPs (don't earn fees) and the protocol, a.k.a. token holders (potentially incurs cost through incentives but earns no revenue) alike.
The analysis could also be more granular if TVL/revenue were disaggregated to account for different ratios of a protocol across chains (e.g. for SushiSwap), which could make sense from an LP perspective. However, for the purpose of this short protocol-level analysis it's not necessary.